The traditional year-end rally may have started with last week’s liftoff on Wall Street, as the Fed’s rate hikes start to bite and the economy shows signs of slowing. Investors hope the economy slows just enough to reduce inflation.
The stock market seems to have bottomed, as short sellers panicked and recently frightened buyers rushed back into the markets. It’s about time, as the signs of a pending reversal have been in place for the past two months, namely a slowing economy and fears about the Fed’s rate hike cycle, which have been mounting as investor’s pessimism rose to a fever pitch. Moreover, the self-perpetuating talk of doom loops led to a bout of panic selling, which reversed as the Fed held rates steady and Friday’s employment report showed a cooling in the labor market.
Of course, there are no certainties in any market. And this rally could easily fizzle. But the longer stocks hold up and bond yields remain subdued, the higher the odds of the rally intensifying.
Buckle up! Santa may be warming up his sled.
The Signs Were There
I’ve been expecting a major reversal in both bonds and stocks since September when the selling in the U.S. Treasury market, and the subsequent rise in yields entered an absurd trading pattern. I chronicled the entire process, including the likelihood of a pending reversal in bond yields on October 15, 2023, when I wrote:
“The slightly-hotter-than-predicted PPI and CPI numbers certainly put a temporary damper on the recent short-covering rally in stocks and bonds, raising investor fears about further interest rate increases. But, as I’ve noted recently, fear is often the prelude to a buying opportunity. Such an opportunity may be developing in the U.S. Treasury Bond market and related interest-sensitive sectors of the stock market, such as homebuilders, real estate investment trusts, and select technology stocks.”
Prior to that, I had suggested that a historic buying opportunity in homebuilder stocks was approaching, while providing an actionable trading plan for such a development here.
Last week, in this space, I wrote: “The stock market is increasingly oversold, so investors should prepare for a potential bounce before the end of the year, especially given the usual bullish seasonality which begins in November and can run through January.”
Bond Yields Crash and Burn and Stocks Respond with Bullish Reversal and Broad Rally
What a difference a week makes, especially in the strange world of the U.S. Treasury bond market. Just two weeks ago, the U.S. Ten Year note yield (TNX) tagged 5%, a chart point which triggered heavy selling in stocks from the mechanical trading crowd, also known as commodity trading advisors (CTAs) and their hedge fund brethren. The selling was further enhanced by headlines about mortgage rates moving above 8%.
But as I noted here, the selling spree had the smell of panic, especially given the lack of a new low in the RSI indicator, when the New York Stock Exchange Advance Decline line (NYAD), as I describe below, made a lower low. The key was whether NYAD broke below its March lows, which it didn’t. This provided the perfect setup for a massive short squeeze, which is currently unfolding.
Here are some details. The U.S. Ten Year Note yield has rolled over, with two significant technical developments occurring:
TNX is now trading inside the upper Bollinger Band, which is two standard deviations above its 200-day moving average. This marks a return to a “normal” trading pattern;It is also testing its 50-day moving average and the 4.5% yield area. Normal trading action suggests that a consolidation in this area should occur before TNX makes a move toward 4.3%; andBullishly for the homebuilder and housing-related real estate stocks, as well as the rest of the market, mortgage rates seem to have topped out as well.
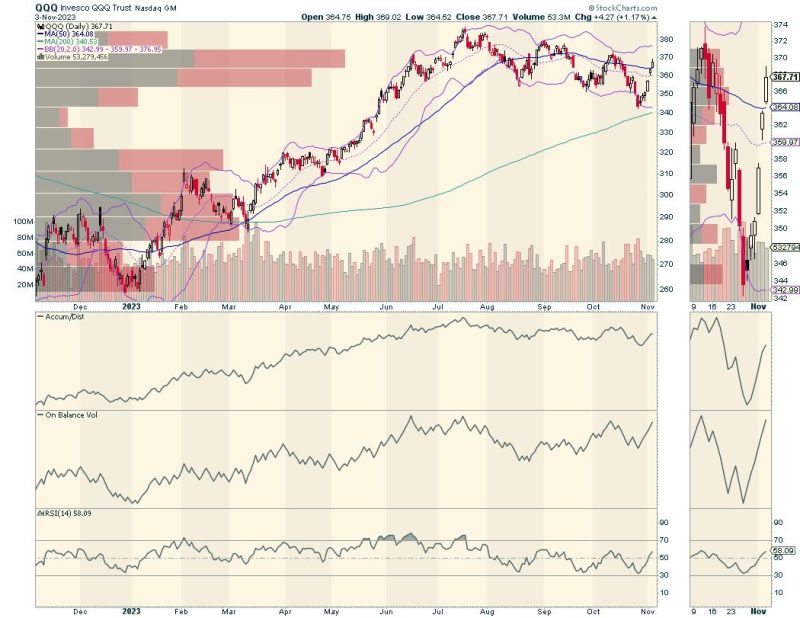
Moreover, as I discuss below, the rally seems be quite broad, as measured by the New York Stock Exchange Advance Decline line. In addition, money is moving back into large-cap technology stocks, as in the Invesco QQQ Trust (QQQ), which also rebounded above its 50-day moving average. Especially encouraging on this price chart is the rally in On Balance Volume (OBV), which signals that the rally is being fueled by real buying along with short-covering, as evidenced by a rising ADI line.
Big tech certainly got a boost, as Microsoft (MSFT) continued its recent climb and is approaching a potential breakout which, if left unhindered, could well take the stock to the $400 area in the next few weeks.
But it’s not just big tech that’s rising. A less obvious member of the QQQ stable, food producer and packager Mondelez (MDLZ), has been quietly moving higher and is now approaching its 200-day moving average. MDLZ’s On Balance Volume (OBV) line is rising nicely as money piles into the shares.
Huge Potential Gains Lurk in Homebuilders
Even better is the unfolding rebound above the 200-day moving average in the SPDR S&P Homebuilders ETF (XHB), where OBV is exhibiting an equally bullish trading pattern. As I noted above, I issued a Buy alert on the homebuilders a few weeks ago, and thus subscribers to my service have been well-positioned for this move in the sector.
Consequently, the rally in the homebuilders may just be starting, especially if interest rates don’t rise dramatically from current levels. As the price chart above shows, mortgage rates may have topped out, along with bond yields. This reversal is already being reflected in the bullish action visible in the homebuilder stocks. Note the following:
Rates are still trading above normal long term trends. The upper purple line on the chart is two standard deviations above the 200-day moving average.Since mortgage rates follow the trend in TNX (above), the odds favor a further decline in mortgage rates, with the first downside target being 6.5%.
Note the nearly perfect correlation between falling bond yields (TNX), falling mortgage rates, and rising homebuilder stocks (SPHB).
Join the smart money at Joe Duarte in the Money Options.com. You can have a look at my latest recommendations FREE with a two-week trial subscription. And for frequent updates on real estate and housing, click here.
Incidentally, if you’re looking for the perfect price chart set up, check out my latest YD5 video, where I detail one of my favorite bullish setups. This video will prepare you for the next phase in the market.
Market Breadth Reverses Bearish Trend
The NYSE Advance Decline line (NYAD) did not remain below is March lows for long, and has now nearly fully reversed its bearish trend as it approaches its 200-day moving average. The price chart below shows the similarity between the unfolding market bottom and that which occurred in October 2022. The circled areas highlight this super cool technical phenomenon where the lack of a new low in the RSI, when NYAD made a new low, marked the bottom. Also note the double top in VIX, which is also repeated.
The Nasdaq 100 Index (NDX) rallied above its 50-day moving average, with both ADI and OBV turning higher as short sellers cover (ADI) and buyers move in (OBV).
The S&P 500 (SPX) also rebounded above its 200-day moving average, returning to bullish territory after its recent dip below 4150.
VIX is Back Below 20
The CBOE Volatility Index (VIX) didn’t stay above the 20 level for long, which is a bullish development.
When the VIX rises, stocks tend to fall, as rising put volume is a sign that market makers are selling stock index futures to hedge their put sales to the public. A fall in VIX is bullish, as it means less put option buying, and it eventually leads to call buying, which causes market makers to hedge by buying stock index futures. This raises the odds of higher stock prices.
To get the latest information on options trading, check out Options Trading for Dummies, now in its 4th Edition—Get Your Copy Now! Now also available in Audible audiobook format!
#1 New Release on Options Trading!
Good news! I’ve made my NYAD-Complexity – Chaos chart (featured on my YD5 videos) and a few other favorites public. You can find them here.
Joe Duarte
In The Money Options
Joe Duarte is a former money manager, an active trader, and a widely recognized independent stock market analyst since 1987. He is author of eight investment books, including the best-selling Trading Options for Dummies, rated a TOP Options Book for 2018 by Benzinga.com and now in its third edition, plus The Everything Investing in Your 20s and 30s Book and six other trading books.
The Everything Investing in Your 20s and 30s Book is available at Amazon and Barnes and Noble. It has also been recommended as a Washington Post Color of Money Book of the Month.
To receive Joe’s exclusive stock, option and ETF recommendations, in your mailbox every week visit https://joeduarteinthemoneyoptions.com/secure/order_email.asp.


