


The percentage of stocks in long-term uptrends rebounded sharply in November and returned to the highs from late August and early September. This rebound is impressive, but the absolute levels are still not that inspiring. We need to see participation breakouts and higher participation levels to get the broad bull market back.
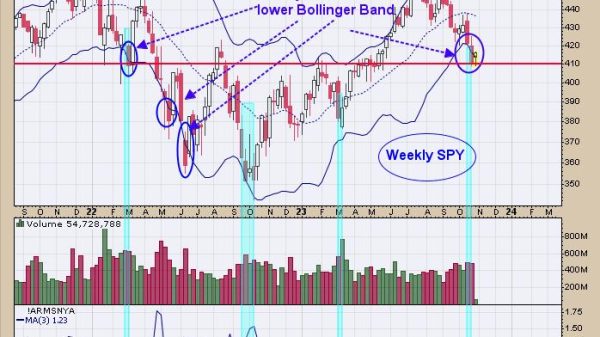
The chart below shows the percentage of stocks above the 200-day SMA for the S&P 500, Nasdaq 100, S&P MidCap 400 and S&P SmallCap 600. This breadth indicator tells us how many stocks are in long-term uptrends, and long-term downtrends. In general, these indicators need to exceed 60% to show enough participation to signal a broad bull market.
First, note I am concerned because these indicators broke their spring-summer lows with deep declines into late October (green shading). The percentage of large-caps ($SPX), mid-caps ($MID) and small-caps ($SML) above their 200-day SMAs dipped to the 25% area. A plunge this deep shows a serious increase in downside participation.
The indicators rebounded sharply with the November advance, but those based on the broad stock indexes have yet to exceed 60% and are at their moment of truth. Note that the percentage of Nasdaq 100 stocks above the 200-day SMA is at 71% and the strongest of the four, by far. The red shading marks the highs from late August and September. While I am impressed with the November surge, I would like to see the percentage of stocks above the 200-day SMA expand above these levels (and above 60%). We can then starting talking about a broad bull market.
TrendInvestorPro uses the percentage of stocks above the 200-day SMA in its Composite Breadth Model, which remains bearish. Even though the S&P 500, Nasdaq 100 and some large-caps are performing well, long-term breadth is lagging and large pockets of weakness remain.
Recent Reports at TrendInvestorPro
The Essential Breadth Indicator ChartList (with report and video)Building a Strategy around the Zweig Breadth ThrustMomentum Rotation Strategy for NDX and SPX StocksMean-Reversion Strategy for Russell 1000 Stocks
Special Action for StockCharts Extra and Pro Members
Get the edge with inside information, information inside the indexes and sectors, that is. TrendInvestorPro put together a comprehensive chart list focusing on breadth indicators. There are over 100 customized charts covering over 50 breadth indicators organized in a logical manner. A full report and comprehensive video accompany this list. Note that you must be an Extra or Pro subscriber to have more than one ChartList at StockCharts.
Click here to sign up for TrendInvestorPro and get this invaluable ChartList!
//////////////////////////////////////////////////