


It’s that time again—holiday cheer, gift spending, and, most importantly, Santa Claus on Wall Street.
Since 1896, the Dow Jones Industrial Average has rallied seven out of ten times in December. This came to mind when doing a scan for stocks (and ETFs) for New 52-Week Highs, where DIA (SPDR Dow Jones Industrial Average ETF), our Dow Jones proxy, came up. If you look at it, its overbought condition is enough to instill the fear of heights in most traders and investors.
How To Scan for Stocks Making New 52-Week Highs
In SharpCharts, from Your Dashboard, scroll the Member Tools on the left and click on Sample Scan Library.The New 52-Week Highs scan is the second from the top on the left side.
Still, a 70% seasonal probability is pretty significant. So, if you are going to jump in, where’s a good spot to hitch a ride on Santa’s sleigh (without getting “slayed” on a massive drop)?
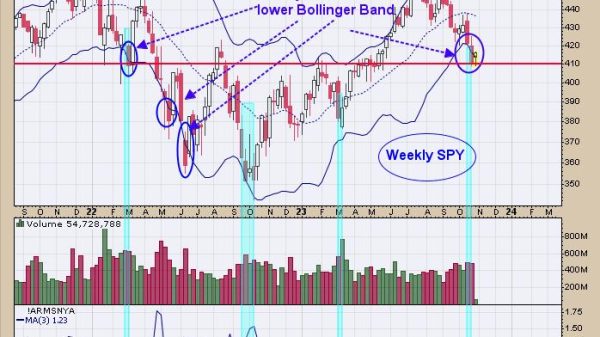
Let’s take a look at DIA’s price action on a weekly scale.
CHART 1: WEEKLY CHART OF SPDR DOW JONES INDUSTRIAL AVERAGE ETF. At record highs, DIA’s first line of support is at former resistance levels, tested twice in 2021 and once in 2023 before being breached.
After surpassing its 52-week high, we can see support at the former resistance “range” centering around $352. DIA is currently pulling back, so let’s take a look at the price action on a daily chart.
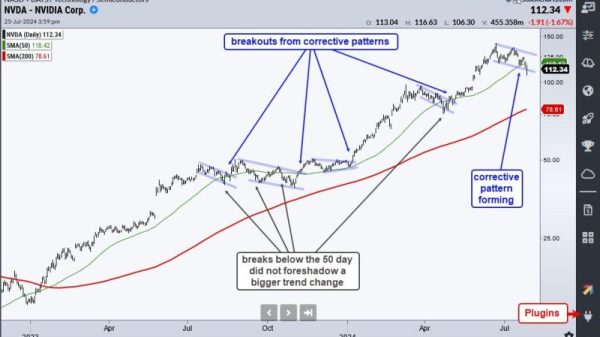
CHART 2: DAILY CHART OF DIA. Bollinger Bands and historical support range seem to converge at the $352 range.
We’re plotting a Relative Strength Index (RSI) below the chart to show just how overbought its reading is on DIA’s price surge. We plot Bollinger Bands to complement this reading, and, indeed, price closed above the upper band last Friday.
With DIA now pulling back, we can arguably expect it to reach the support ranging near the $352 price level. This price level also coincides with the Bollinger Band’s middle band, strengthening the case that, at least in terms of market sentiment, buyers are likely to jump in at that level. This would prompt a bounce and, quite possibly, the Santa Claus rally that seasonality traders are expecting.
The Bottom Line
Considering the historical 70% likelihood of a December rally in the Dow Jones Industrial Average and DIA’s current pullback from its “overbought” highs, investors might see this as a favorable trigger for market engagement. Just remember that seasonal tendencies are never guaranteed, so keep an eye on technical and fundamental developments before attempting to jump into this anticipated (and always welcome) holiday rally.
Disclaimer: This blog is for educational purposes only and should not be construed as financial advice. The ideas and strategies should never be used without first assessing your own personal and financial situation, or without consulting a financial professional.