As its name suggests, the ATR Trailing Stop is normally used to trail a stop-loss for a long position. It can also be used to identify an outsized decline that could reverse an uptrend. Today’s example will show how to apply the ATR Trailing Stop on a breakout and use it to define the current uptrend in the Technology SPDR (XLK).
ATR is the Average True Range, which is a volatility indicator developed by J Wells Wilder. The bottom indicator window shows ATR (22) at 3.091 for the Technology SPDR (XLK). The green line on the chart is the ATR Trailing Stop (5 x ATR(22)). 5 is the multiplier. This means it is 5 ATR(22) values below the highest close since November 6th, which is when XLK broke out. When prices rise, this stop will trail prices higher and always remain 5 ATR(22) values below the highest close of the move.
Why did I pick 5 for the multiplier? At the time of the breakout, I choose 5 as the multiplier because this value placed the initial stop just below the late October low (gray line). This is the natural level to set a stop because it represents a support level based on a reaction low. Note that this indicator is part of the TIP Indicator Edge Plugin for StockCharts ACP.
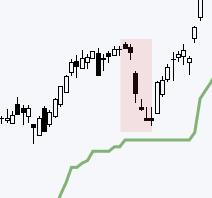
The ATR Trailing Stop can also be used to define an uptrend. There were two sharp pullbacks during the current advance. The red shadings in early January and late February mark these pullbacks. The ATR Trailing Stop held in both cases, which means the pullbacks were less that 5 ATR(22) values. A decline that breaks the ATR Trailing Stop would be greater than 5 ATR(22) values and this would be an outsized decline. Trend changes often happen with outsized moves so I will be watching the ATR Trailing Stop going forward.
Chart Trader reports and videos focus on stocks and ETFs with uptrends and tradeable patterns. Each week we cover the overall market environment and then feature highly curated trading ideas. This week we covered the Copper Miners ETF (COPX), the Metals & Mining SPDR (XME), the Bank ETF (KBWB), Moderna (MRNA), Illumina (ILMN) and more. Click here to learn more and get immediate access.
///////////////////////////////////


