


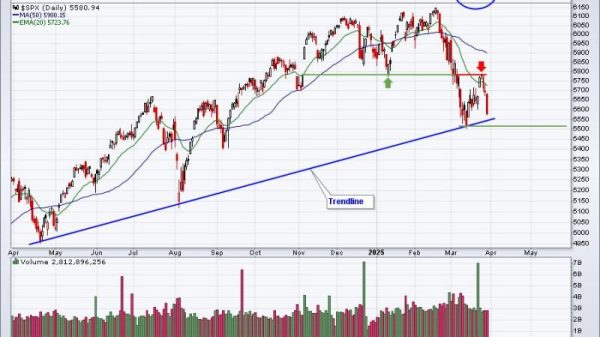


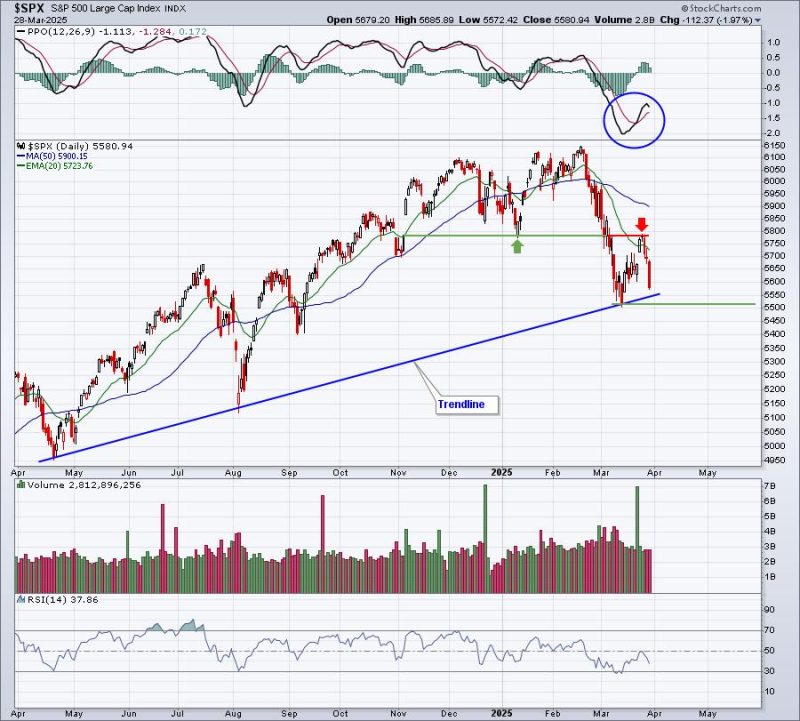
The key resistance level I’ve been watching on the S&P 500 hasn’t wavered. It’s 5782. The bulls had a real chance this past week to clear this important hurdle and they failed. Badly. If this was a heavyweight fight, the ref would have called it after the first round. It simply wasn’t close. Resistance failed, rotation turned bearish, volatility again expanded, and the bears are celebrating another short-term victory.
Check out this S&P 500 chart:
I’ve written about this to EarningsBeats.com members. I posted this exact chart in my StockCharts.com article a few days ago. I’ve discussed it on my YouTube shows. 5782 is THE key short-term price resistance and you can see above that the S&P 500 literally did an “about face” as soon as it touched this resistance. Sellers were lined up. Now that we’ve failed at 5782, it only makes this resistance level that much more important on any future rallies.
The serious technical damage occurred over the past 3 days as consumer discretionary stocks have been absolutely TROUNCED, while consumer staples hangs near its recent highs. If you recall, it was this HUGE disparity in consumer stocks on February 21st that triggered the massive selling episode. Now here we are again with consumer staples stocks (XLP) outperforming discretionary (XLY) by a mile. Check out this chart:
Doesn’t the action in consumer stocks the past 3 days exactly mirror the action we saw in the 2nd half of February and into the first week of March? Folks, this isn’t good.
This is just the tip of the iceberg.
Bear Market Ahead?
The S&P 500, from its recent all-time high to its subsequent low, fell 10.4%, which marks correction territory. The rally we saw off the March 13th low was likely due to oversold conditions, along with March options expiration. On Tuesday, March 18th, we discussed with our EB.com members that odds favored a short-term rally, based on max pain and we laid out key resistance from 5670 to 5782, with the 20-day EMA falling in the middle of this price range. Once we failed at 5782, it was very important to gauge the nature of any new selloff. That’s what I’ve been evaluating this week and it’s not pretty. As you can see in the chart above, money has once again started rotating into the XLP and out of the XLY. This is one of the most important intermarket relationships and it’s screaming BEARISH ACTION AHEAD!
It’s only one signal, however. I announced a few days ago that we’d be hosting a FREE webinar on Saturday morning, March 29th, at 10:00am ET. I plan to discuss several signals that are pointing to exactly what we saw on Friday – more selling. To get a better handle on current market conditions and where we’re heading, I’d encourage you to join me Saturday morning by REGISTERING HERE. If you can’t make the live webinar, we’ll still send out the recorded video to all who register, so ACT NOW!
And here’s a little secret. Shhhhhhh! Market makers are playing some serious games manipulating some of the biggest stocks. I’ll talk a bit about how we can take advantage of that Saturday morning. Hope to see you there!
Happy trading!
Tom