


It was an ugly close to another roller-coaster trading week as the stock market struggled with several moving parts. Wednesday’s Evening Doji Star in the S&P 500 ($SPX) showed its power. The trading week didn’t end on a pretty note.
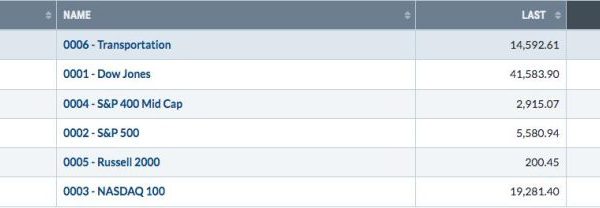
The S&P 500, Nasdaq Composite ($COMPQ), and Dow Jones Industrial Average ($INDU) all closed lower and are trading below their 200-day simple moving average (SMA). And the selloff is across the board. It’s not concentrated in the heavily weighted stocks.
The headwinds: Auto tariffs, declining consumer confidence, and hotter-than-expected PCE data. These have raised investor fear once again. The Cboe Volatility Index ($VIX) spiked higher on Friday, closing at 21.65.
From a sector perspective, Utilities was the only S&P sector that closed in the green on Friday, which reiterates defensive investor sentiment. This could continue for as long as investors worry about inflation and weakening U.S. economic growth. In addition to defensive sectors, other areas of the market show some bullish strength.
What Are Investors Eyeing?
Bond prices are rising. The daily chart of the iShares 20+ Year Treasury Bond ETF (TLT) is trading above its 50- and 100-day SMA. A break above the 200-day SMA would set a positive tone for bond prices although if past price action is of any value, TLT didn’t have much success the last couple of times it crossed above the 200-day. It could be different this time.
FIGURE 1. BOND PRICES SHOW SIGNS OF LIFE. Bond prices are now starting to rise. Will we see an RSI above 70 when TLT crosses above its 200-day simple moving average? Chart source: StockCharts.com. For educational purposes.
The relative strength index (RSI) in the lower panel is above 50. The last couple of times TLT crossed above its 200-day SMA, RSI failed to cross above 70, indicating a lack of momentum. However, if TLT crosses above its 200-day SMA and coincides with an RSI cross above 70, that could be an alert for a gain in momentum.
Bonds were starting to trend higher after hitting their January lows but that uptrend consolidated from early March. There needs to be an upside follow-through for an uptrend to resume in bonds. There’s still time for it to play out but keep your eyes on this chart for the next few weeks.
Gold and silver prices have also been on a tear. Gold hit an all-time high on Friday while silver pulled back on Friday after Thursday’s price spike. Overall, the uptrend is still intact in both metals.
If you’re a regular reader of our ChartWatchers Newsletter, you’ll recognize the chart below which looks at the performance of various asset classes.
FIGURE 2. PERFCHART OF DIFFERENT MARKETS. Gold and silver have outperformed most other asset groups. Chart source: StockCharts.com. For educational purposes.
Note how gold and silver prices are outperforming equities.
Last but not least, let’s analyze the performance of the automobile sector, the most impacted industry group this week. Automobile stocks continue to slide. The daily chart of the Dow Jones US Automobiles Index ($DJUSAU) below displays a clear picture of the state of the industry.
FIGURE 3. THE AUTOMOBILE INDUSTRY. Things aren’t looking great for the automobile industry. After attempting to cross above the 200-day SMA, the Dow Jones Automobiles Index fell and is trending lower. Chart source: StockCharts.com. For educational purposes.
After a healthy run in the second half of 2024, the industry has been in a steep decline, with any attempts of a rally being short-lived. On March 25, $DJUSAU crossed above its 200-day SMA but failed to hold above it. There’ll be more tariff news between now and April 2. So be prepared for more volatility in the automobile industry.
The Bottom Line
Q1 has been pretty dismal, mainly due to tariff policies. There’s more to come. With “Liberation Day” approaching, expect more volatility in the stock market. There’s also the March jobs report on Friday. Equity futures are trading lower ahead of Monday’s open.
We’ll end with a chart that every investor should be monitoring closely as we get through the next few months—a three-year weekly chart of the S&P 500. Feel free to save this to your ChartLists.
FIGURE 4. WEEKLY CHART OF THE S&P 500 INDEX. The index attempted to move beyond its July and August highs but didn’t succeed. With more tariff news on the horizon, will the S&P 500 succeed or will it move toward its March highs? Chart source: StockCharts.com. For educational purposes.
Disclaimer: This blog is for educational purposes only and should not be construed as financial advice. The ideas and strategies should never be used without first assessing your own personal and financial situation, or without consulting a financial professional.